
Earlier this month, Health Canada released new data on the average wholesale unit price of manufactured cigarettes sold in each Canadian province over the past 16 years. This data allows us to compare the revenue generated by cigarette manufacturers in each province during that period, including on a per-smoker basis and in comparison with revenues from tobacco taxes in each jurisdiction.
The "average" price says little about what an individual smoker pays, but says a lot about what the companies earn.
From the purchaser's perspective, the "average" wholesale price is not a helpful indicator. For the most part, few people pay the "average" price for a pack of cigarettes. Some brands cost more than others, some stores charge more than others, and some provinces charge more tax than others.
From a corporate income perspective, however, the "average" price is a core indicator. And when combined with public data on volume of cigarettes sold in each province, it allows us to calculate the dollar value of smokers to the companies' overall bottom line.
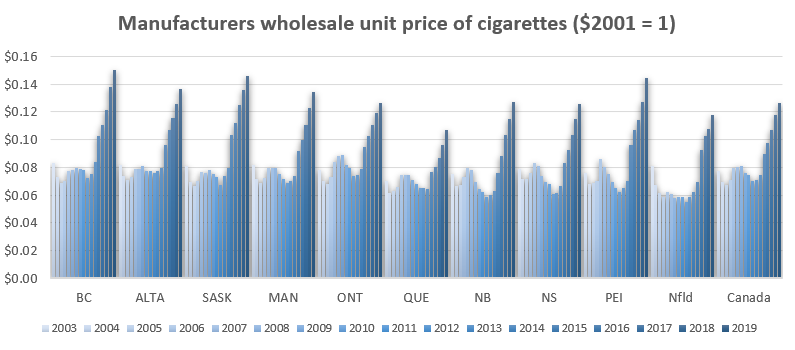
The average wholesale price of cigarettes in Canadian provinces has increased by 75% to 123% over the past five years
After more than a decade of stable pricing, tobacco companies began to sharply increase their wholesale prices over the past 5 years, from a national average of $0.095 per cigarette in 2014 to $0.176 in 2019, providing them an additional 85% per cigarette sold. In some provinces the average price was higher, as was the rate of increase. This may be because smokers in some provinces purchase more expensive brands, or it may be because manufacturers charge higher prices or offer fewer price discounts to retailers in some provinces. Because of inflation, the adjusted value of these increases is somewhat less, but still significant, as shown below.
Tobacco companies make $300 more per year from smokers than they did 5 years ago
Nation-wide, the amount of revenue generated by the industry for each Canadian smoker rose from $517 in 2014 to $898 in 2019.
Differences between the provinces can be attributed to differences in the amount of cigarettes purchased (some may smoke more or may purchase contraband) as well as differences in the brands chosen or wholesale prices charged. In 2019, the companies made the most revenue from smokers in the three most western provinces (about $1,100 per year per smoker) and the least in Quebec ($750 per smoker). Their revenue from each smoker has increased by an average of 74% since 2014 - ranging from 53% in Alberta to 100% in Nova Scotia.

Tobacco companies earn about $2.50 per day from Canadian smokers
On a daily basis, smokers in Canada provide from $2.05 (Quebec) to $3.06 (British Columbia) in revenue to cigarette manufacturers. The companies earned $1.04 more per day from the 4.7 million smokers in 2019 than they did from than 5.4 million smokers of 2014 ($2.46 vs $1.42). In some provinces the increase was almost a double: in British Columbia the average smoker paid $3.06 in 2019, compared with $1.51 in 2014.

Tobacco companies' wholesale revenue is increasing faster than provincial tobacco taxes.
Earlier this month we showed how federal tax revenue was lower and falling relative to wholesale prices. This new data allows us to see that across Canada, while provincial tax revenues are generally higher than industry revenues they are also falling behind. (Ontario collects less in tax revenue than the industry earns from sales in that province) The examples of the province with the highest excise taxes (Manitoba) and the lowest (Quebec) are shown below, with links to data for all provinces provided below. Tobacco taxes are reported for a financial year ending in March, while corporate revenue is provided for the calendar year.


- The business data Health Canada requires tobacco companies to report provides insight into their evolving pricing practices. These companies are generating significantly more revenue in recent years than historically.